Charts for your plant
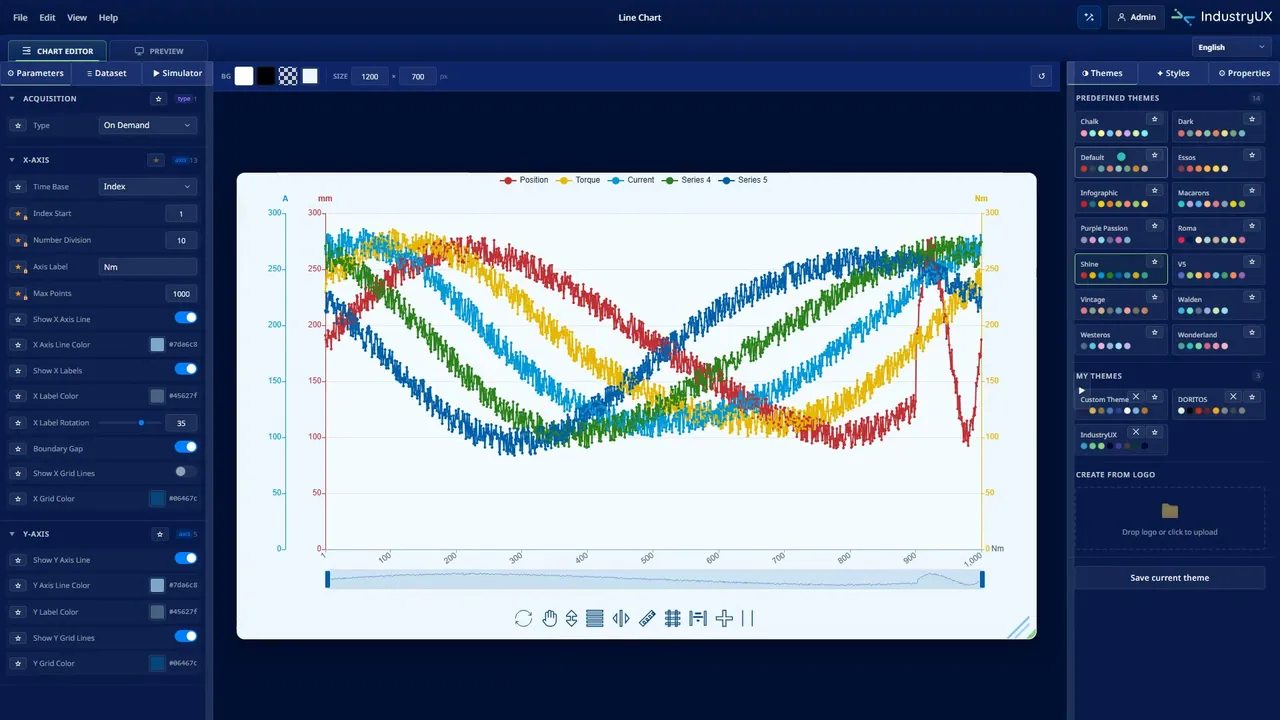
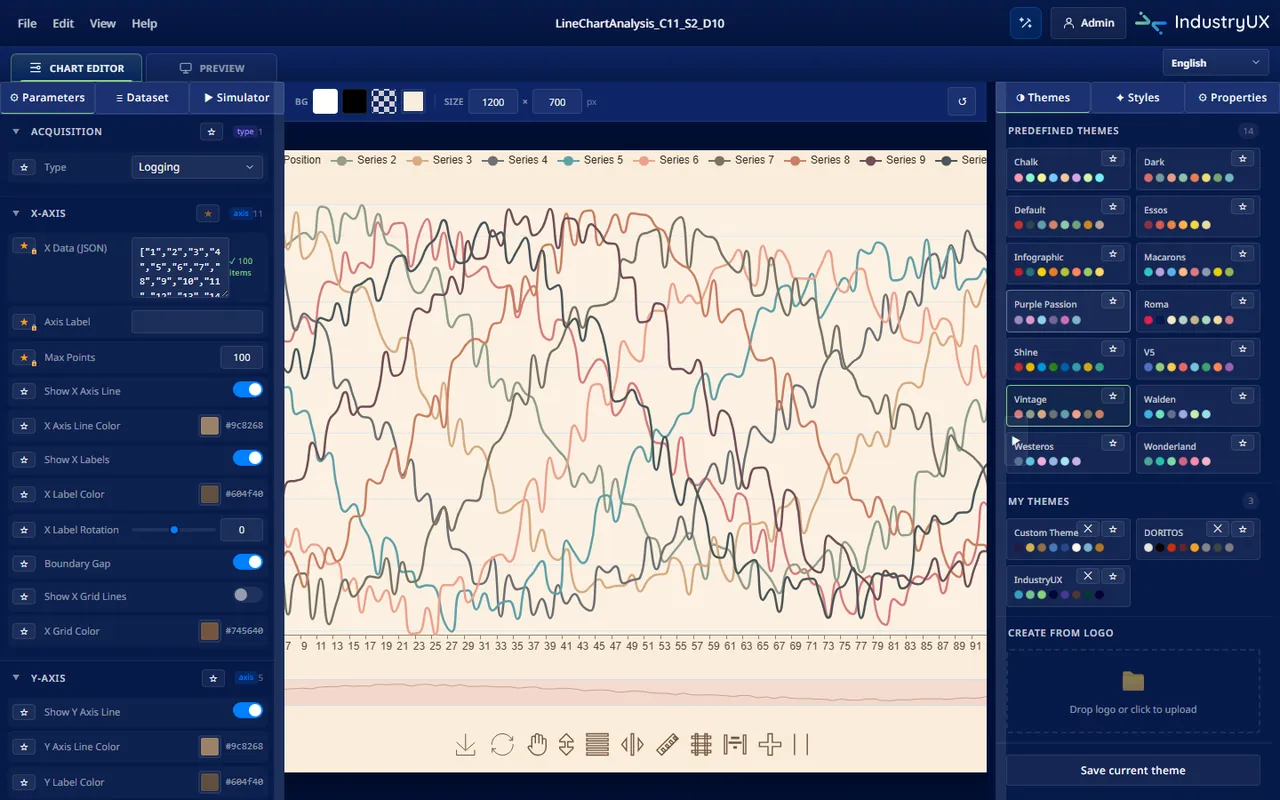
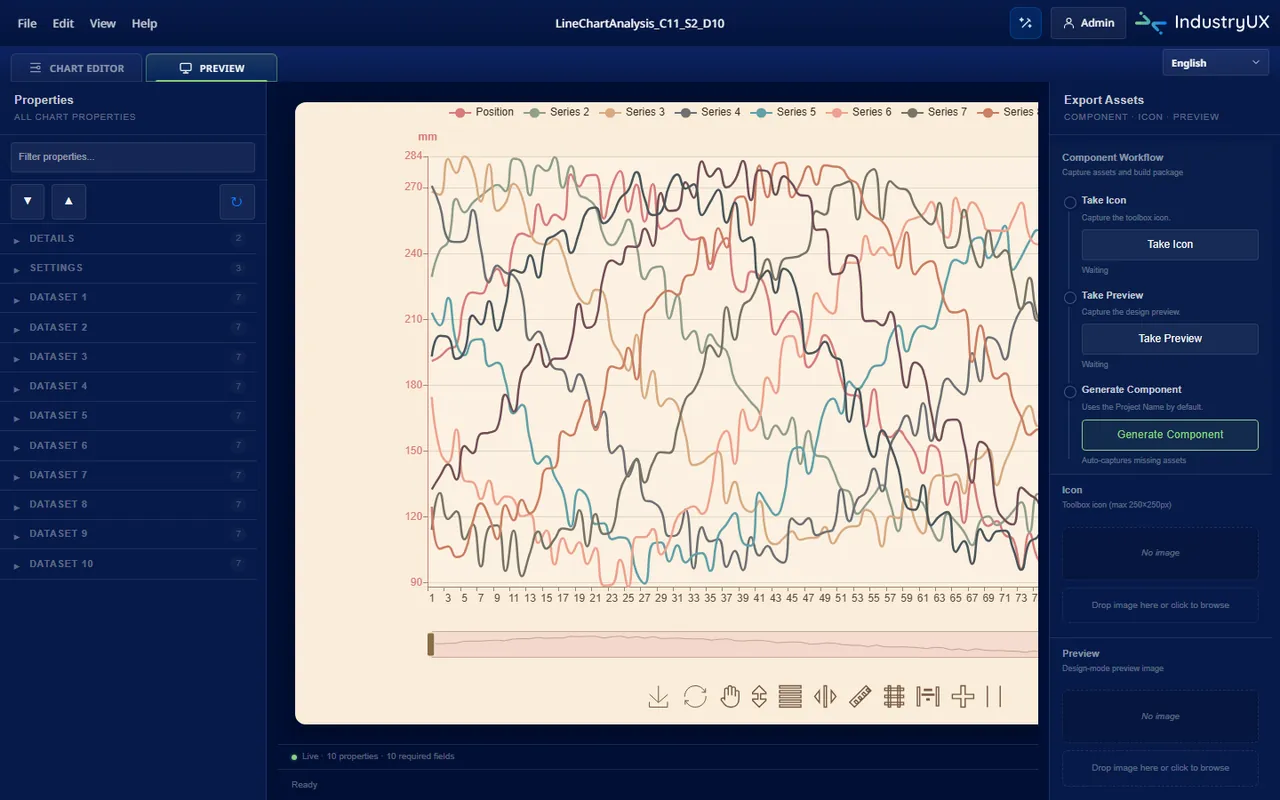
Plants are full of data that nobody looks at. A chart earns its place when it helps someone decide: slow down, intervene, keep going. Chart Builder turns your process data into charts your operators read at a glance — on the panel where they work, not on a separate dashboard. You choose the type, connect your series, and set thresholds, axes and legend without writing code.
Available types
Line and area charts for trends, bars for comparisons, pie for proportions, scatter and radar for analysis, gauges for live values — plus high-performance trends for dense industrial traces. Thresholds, alarm zones, measurement cursors and zoom are built in. The export is ready for your HMI or SCADA — multi-brand, multi-platform.